
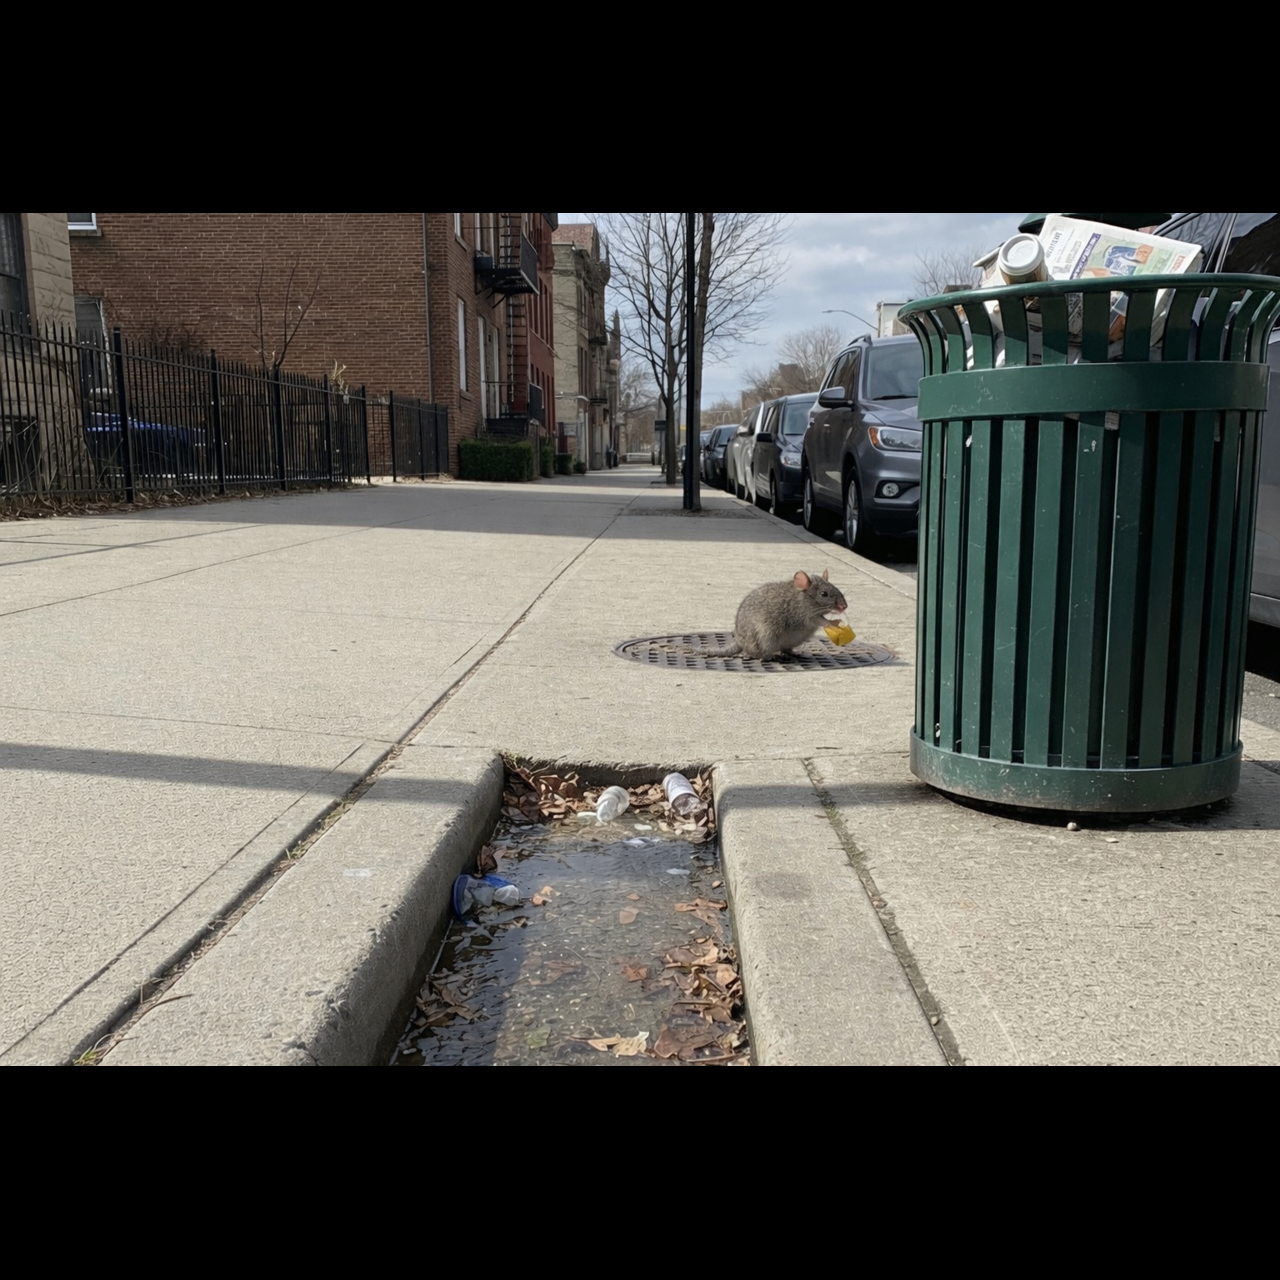
Example 1 — Click image to show saliency map (color, then grayscale)
Example 2 — Click image to show saliency map (color, then grayscale)
TLDR
We propose an image-computable model, AUTO-SUM (Automatic Scene Understanding Map), which follows the scene understanding map of Murlidaran & Eckstein, Nat. Commun. 17, 940 (2026). The model measures the importance of each object in a scene for scene understanding, and also serves as a saliency model based on high-level semantic meaning.
Motivation
For 25 years, visual saliency has shaped how we understand attention, predicting where people look based on low-level image features like luminance contrast, color, and orientation. But low-level saliency misses something fundamental: humans don't fixate on bright or high-contrast regions, they fixate on meaningful ones. Even with no task or instructions, people's eyes are drawn to objects and regions that matter for understanding a scene—not merely to whatever pops out visually. Low-level saliency models, built around center-surround contrasts, have no notion of what an object means or how it contributes to making sense of a scene. As a result, they systematically fail to capture the high-level, semantic component of human attention. Our approach instead models semantic saliency: how much each object contributes to the actual understanding of a scene. Rather than asking "what stands out?", we ask "what matters?" This better predicts human fixations during free viewing and scene understanding than traditional saliency—or even modern deep-learning gaze models—because it captures the cognitive, meaning-driven nature of where people look. The catch: measuring scene understanding through human ratings (removing objects and asking how much scene descriptions change) is powerful but labor-intensive and slow, making it impossible to scale. Our method overcomes this bottleneck, bringing the predictive advantages of semantic saliency to large image databases without the prohibitive cost of human annotation.
GBVS fails to highlight the saliency of the spider in the scene, whereas Auto-SUM captures this semantic importance.
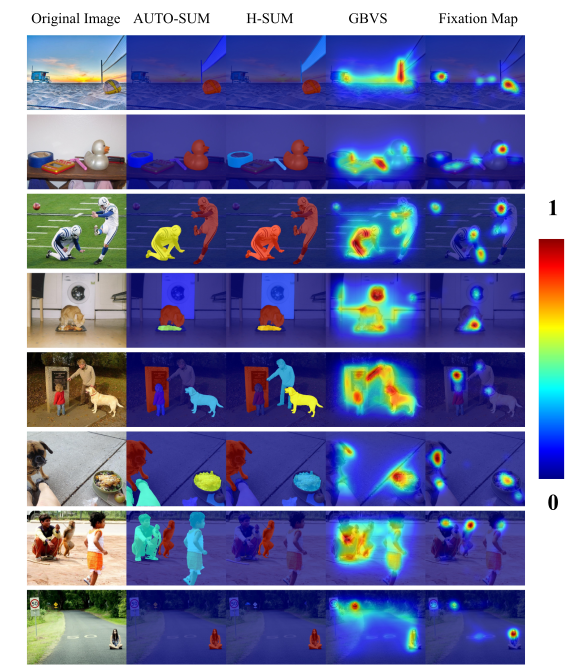
AUTO-SUM predicts the Human Scene Understanding Map (H-SUM)
AUTO-SUM-C is an implementation of AUTO-SUM based on closed-source models, using Google Nano Banana 2 as the image inpainting model and GPT-5.4 as the scene description model. AUTO-SUM-O is an implementation of AUTO-SUM based on open-source models, using MAT (Mask-Aware Transformer) as the image inpainting model and Ovis2 as the scene description model.
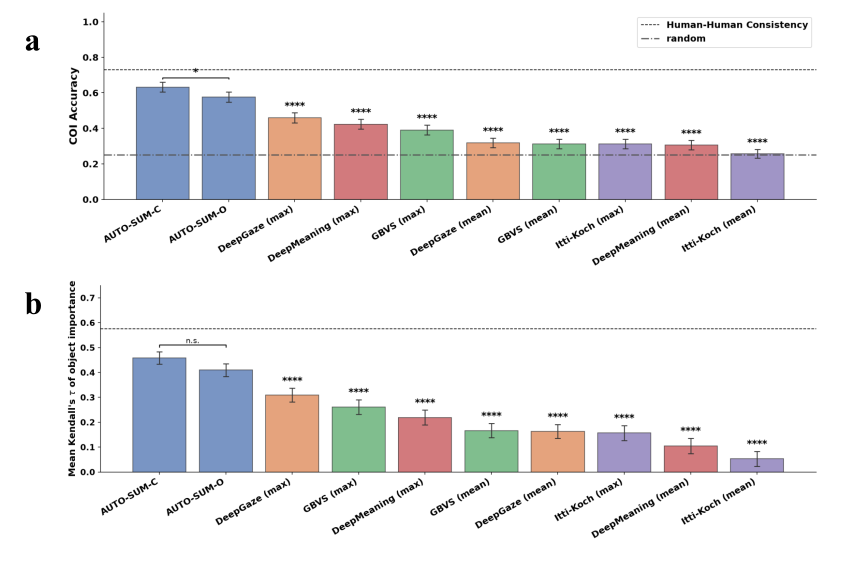
(a) Critical Object Identification (COI) accuracy: the proportion of images in which a model's highest-scoring object matches the object with the largest impact on human scene understanding. The ground truth is the H-SUM of one group of five participants. Human–human consistency (dashed line) is the accuracy with which the H-SUM of the other five participants predicts the ground truth. The dash-dotted line shows the expected accuracy of selecting one object at random from each scene.
(b) Rank-order correlation between the H-SUM and the SUM predicted by each model, measured as Kendall's τ between the two object-importance rankings and averaged across images. The dashed line shows human–human consistency.
(max) and (mean) denote object scores computed as the maximum or the mean of a model's map within the object mask. All the error bars are obtained using the std of bootstrap samples of images and subjects. * = p < .05; ** = p < .01; *** = p < .001; **** = p < .0001 from one-tailed bootstrap test.
AutoSUM as a saliency model to predict human fixation
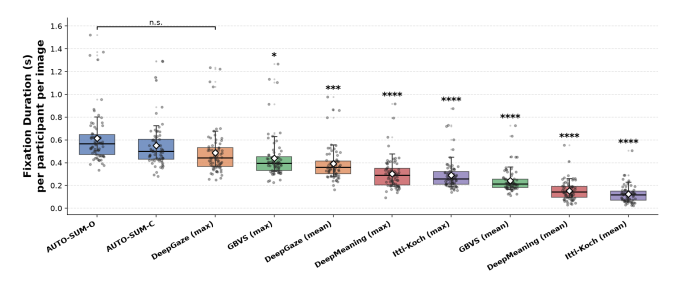
Evaluation of each model's ability to predict human fixations on 36 Winoground images in Murlidaran & Eckstein, Nat. Commun. 17, 940 (2026).
Mean Fixation Duration (s) of the highest-scoring object under each model. The box is calculated based on the quartiles of the subjects' data (n=45), the middle line indicates the median. The diamond is the per-participant mean and the error bars are obtained using the 2.5%–97.5% percentile CI of bootstrap samples of both subjects and images. Each data point here represents a subject.
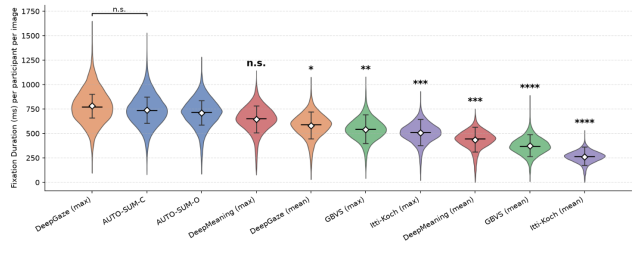
AUTO-SUM predicts human fixations on 40 images from Linka, Karimpur & de Haas, Nat. Hum. Behav. 9, 1887–1897 (2025). Fixation duration (ms) on the highest-scoring object of each model, per participant per image. Violins show the distribution across 6,820 participants; the diamond is the per-participant mean, and the error bars are obtained using the 2.5%–97.5% percentile CI of bootstrap samples of both subjects and images.
Pipeline Architecture
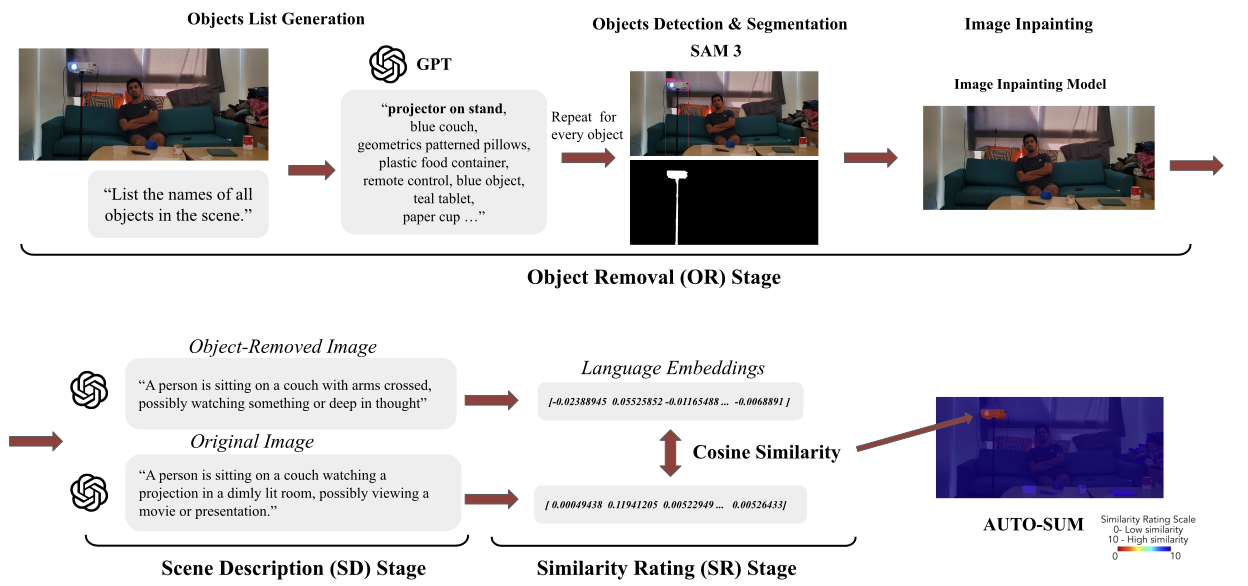
Auto-SUM pipeline: from input image to object importance (semantic saliency) via detection, segmentation, inpainting, and similarity evaluation.
Auto-SUM consists of six main steps from object discovery to importance scoring:
- Object lists generation — Vision-language models (e.g., GPT) list object names in the scene; multiple lists per image are merged for robustness.
- Object detection & segmentation — Grounded-Segment-Anything (Grounded-SAM) localizes and segments each detected object.
- Mask post-processing — Duplicate masks are removed (overlap/MSE thresholds); dilation is applied for better mask quality.
- Image inpainting — Detected objects are removed using an inpainting model (e.g., MAT), yielding “object-removed” scenes.
- Scene description generation — Both original and inpainted images are captioned to describe the scene (e.g., “what might be happening in this scene”).
- Similarity evaluation — Embedding-based similarity (e.g., jasper) between original and inpainted scene descriptions is computed; lower similarity indicates higher importance of the removed object for scene understanding.
References
-
Carion, N., Gustafson, L., Hu, Y.-T., Debnath, S., Hu, R., Suris, D., Ryali, C., Alwala, K. V., Khedr, H., Huang, A., & others. (2025). Sam 3: Segment anything with concepts. arXiv preprint arXiv:2511.16719. arXiv:2511.16719
-
Li, W., Lin, Z., Zhou, K., Qi, L., Wang, Y., & Jia, J. (2022). Mat: Mask-aware transformer for large hole image inpainting. In Proceedings of the IEEE/CVF conference on computer vision and pattern recognition (pp. 10758-10768). CVPR 2022
-
Murlidaran, S., & Eckstein, M. P. (2025). Eye movements during free viewing to maximize scene understanding. Nature Communications. Nature Publishing Group UK London. Nature Communications
-
Linka, M., Karimpur, H., & de Haas, B. (2025). Protracted development of gaze behaviour. Nature Human Behaviour, 9, 1887–1897. Nature Human Behaviour
-
Harel, J., Koch, C., & Perona, P. (2006). Graph-based visual saliency. In Advances in neural information processing systems (Vol. 19). NeurIPS 2006
-
Zhang, D., Li, J., Zeng, Z., & Wang, F. (2024). Jasper and stella: distillation of sota embedding models. arXiv preprint arXiv:2412.19048. arXiv:2412.19048
-
Lu, S., et al. (2024). Ovis: Structural embedding alignment for multimodal large language model. arXiv preprint arXiv:2405.20797. arXiv:2405.20797
BibTeX
@article{wen2026semantic,
  title={Semantic Saliency from Multi-Modal Large Language Model Scene Understanding Maps},
  author={Wen, Ziqi and Murlidaran, Shravan and Skaza, Jonathan and Wang, William and Eckstein, Miguel P},
  journal={arXiv preprint arXiv:2610.15467},
  year={2026}
}